Yes, it’s true. You can save your Activity logs for as long as Azure Log Analytics allows.
Azure Activity log
As you know, everything you add, update or remove from an Azure Subscription is logged in the Activity log. It is a very useful feature as it can help you find out who added a resource or even who deleted something important.
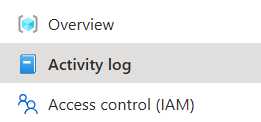
You can find the activity log in both at the subscription as well as any resource group by clicking it in the left hand menu.
Expiring logs
The downside of this log is that it is only stored for 90 days. This means that if you need to look further back into the past, you will not find anything.
You can, however, mediate this problem going forward using Export Activity Logs feature. Note that it is not a time travel device. Data will not be restored just because you use this feature.
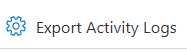
Export Activity Logs
Finding it is not hard. Just find the Activity log you want to export and find this button at the top of the main blade.
Exporting logs to Log Analytics
You can export logs to several different data storages such as storage account or Eventhubs. To me, Log Analytics is the best one as you can use a potent query language when you need to find information later.
Create the Log Analytics workspace
Start by creating a Log Analytics workspace. The region does not really matter, but you need to create the Workspace in order to
- Connect your Activity log to it
- Set the retention policy, i.e. how long do you want to keep the log.
You can export the Activity logs to an existing workspace, but I suggest a centralized log for each subscription, allowing only the correct people access, such as Security Admins or Azure Resource Admins.
Set the retention policy (easy mode)
After you have created the workspace, in the left menu find Usage and estimated costs and click it.
At the top of the main blade find the Data Retention button.

Clicking it will show a flyout to the right. Here you can set the standard retention for the entire workspace. I suggest you do not use this feature as the same retention will be used for every table in the workspace, even future ones. We will set the retention later.
Configure the log for export
Go back to the Activity log. It is worth knowing that if you configure export on a Subscription level, all resource groups will be included in the export.
Find and click the Export Activity Loga button at the top in the main blade.
On the new page, find and click + Add diagnostic setting
You have reached the configuration page, and you need to configure it according to you logging needs. Click the options for what you want to export. I suggest to export at least Administrative as this logs CRUD-operations for resources.
In the destination details, choose Send to Log Analytics workspace and find the Log Analytics workspace you created earlier.
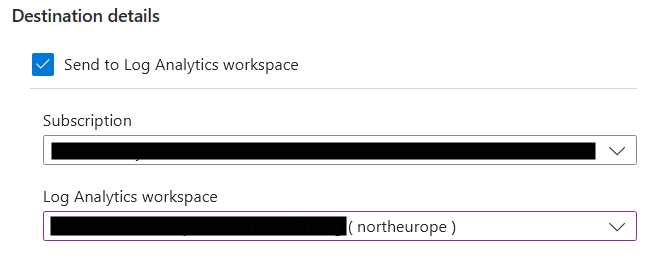
Don’t forget to give the diagnostic setting a name and save your new configuration.
Test the logging functionality
You need to have something trigger a row in the Activity log. Any resource CRUD operation will. I suggest that you create something new, such as a resourcegroup, add a storage account and the delete it.
After that, make sure that your activity has been logged in the regular Activity log. When you are sure your activities have been logged, open the Log Analytics workspace you connected earlier.
To the left, find Logs and click it.
Click Select a table at the top and make sure you have a table called AzureActivity. Click it to see the contents of that table. You should have, at least, your recent activities there. If it’s empty, give it some time and retry the query. Sometimes it takes a while before the data is available.
Retention policy basics
Now it’s time to set the retention policy. Before you do that you need to understand two concepts:
- Interactive retention
- Archive period
When you configure retention, you have to decide: How long do you want to keep the data (Total retention period), and how long do you want to be able to easily query that data (Interactive retention). The Archive Period is the Total retention period minus the Interactive retention.
You can still access data after it is archived. It is just harder.
The longer the Interactive retention, the more cost, but still not a lot. Details here.
Set the retention policy (better mode)
Time to set the retention. You can do that on a per table level instead of the whole workspace. Simply follow these steps.
- In the workspace find
Tables to the left.
- Find the table named
AzureActivity and click the three dot menu to the right.

- Choose Manage table
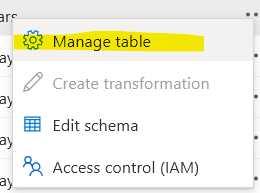
- Set the retention according to your needs. Here is on configured to keep data for two years and it will be interactive for one year.
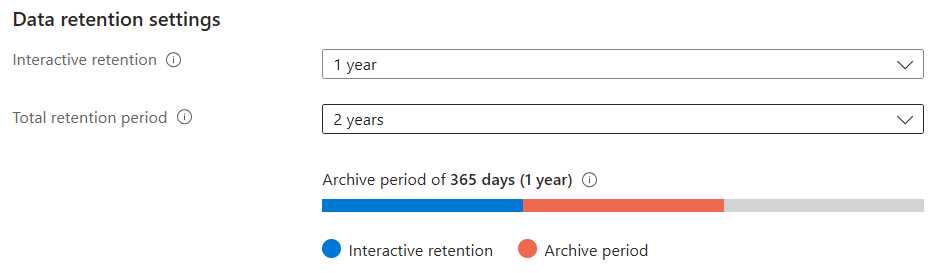
Note that you can set your retention period to 12 years!
KQL
If you do not want to see all the data in the log table you can use the query language called KQL. I will not go into any deep stuff here but here is how you use it in a Log Analytics workspace. Note that I am far from a KQL guru.
- Go back to the
Logs.
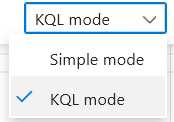
- On the right side, change from
Simple mode to KQL in the dropdown.
- Start writing your query. Here are some examples:
List the activity for the give user for the last 24 hours.
AzureActivity
| where Caller == "user@domain.onmicrosoft.com"
Show all the delete operations for the last 24 hours
AzureActivity
| where OperationNameValue contains "DELETE"
Show all the operations from a given IP-address for the last two days
AzureActivity
| where CallerIpAddress == "81.170.238.13"
| where TimeGenerated >= ago(2d)
Conclusion
Being able to extend the log retention of the Azure Activity log is useful for many reasons. Storing the data in an Azure Log Analytics Workspace makes it easy to query and help you find answers to questions relating to resource management in Azure, even after 90 days.
